3. Quality control
3.1. Preface
There are many sources of errors that can influence the quality of your sequencing run [ROBASKY2014]. In this quality control section we will use our skill on the command-line interface to deal with the task of investigating the quality and cleaning sequencing data [KIRCHNER2014].
Note
You will encounter some To-do sections at times. Write the solutions and answers into a text-file.
3.2. Overview
The part of the workflow we will work on in this section can be viewed in Fig. 3.1.
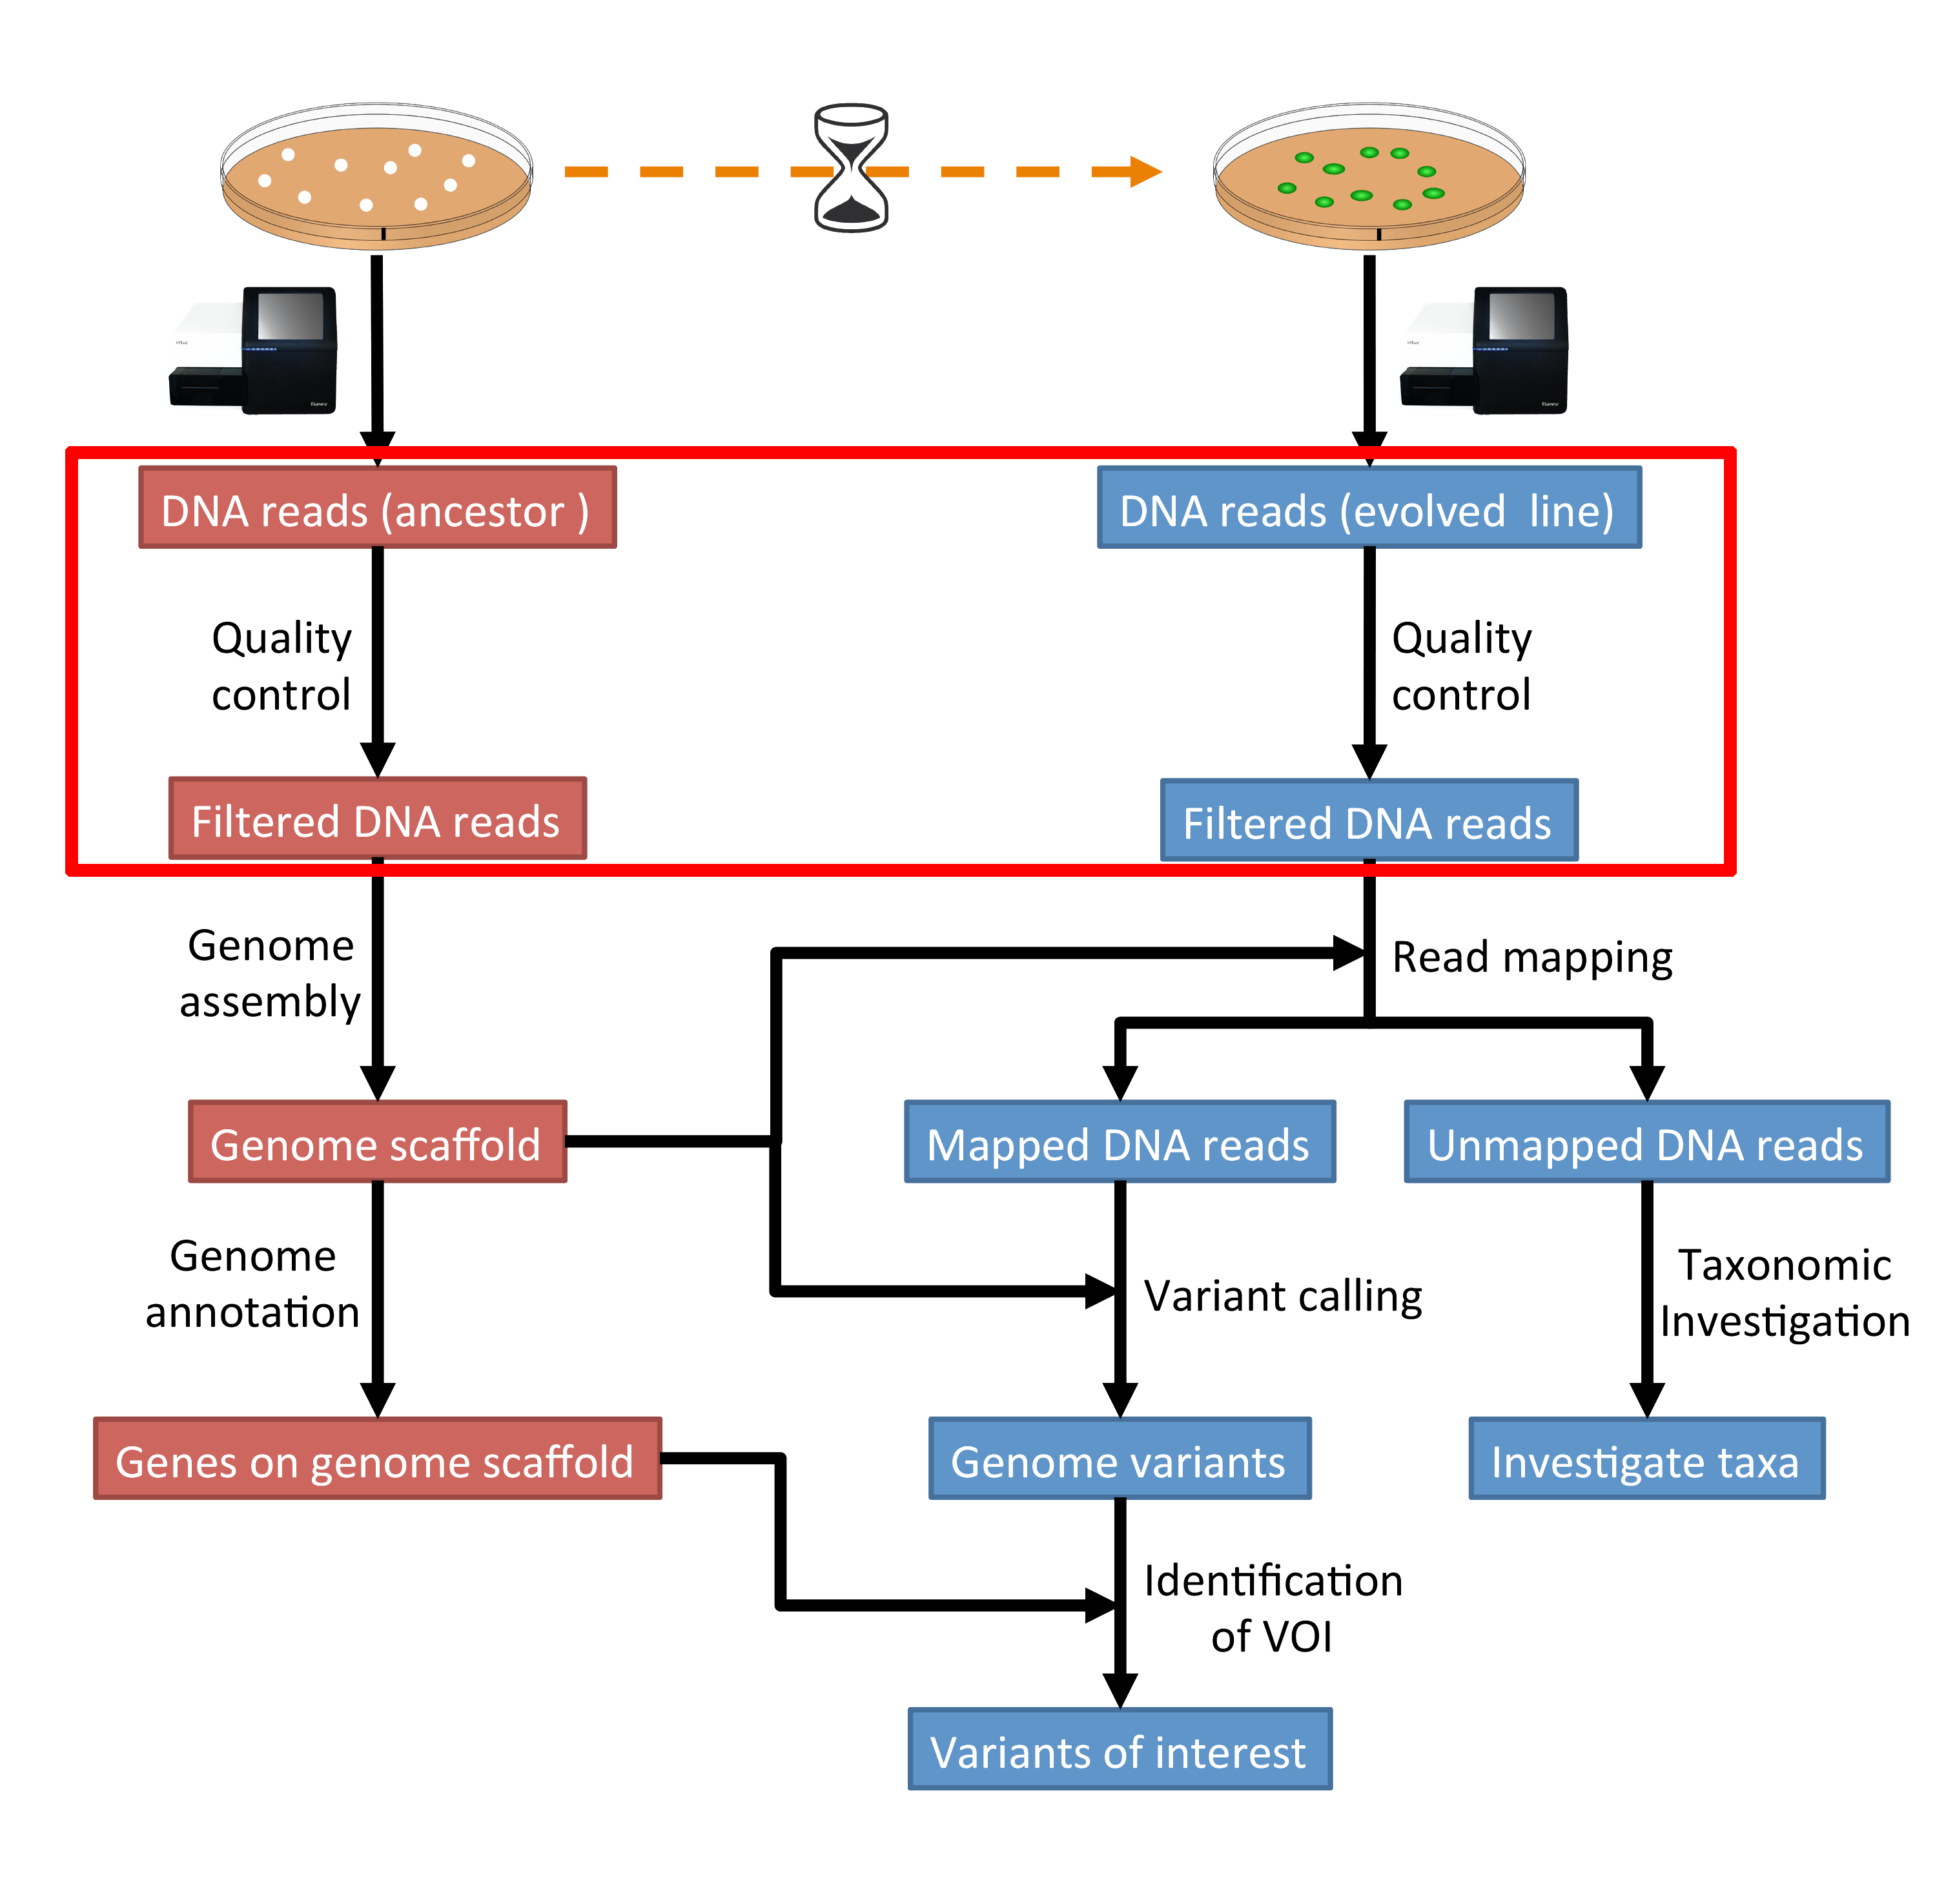
Fig. 3.1 The part of the workflow we will work on in this section marked in red.
3.3. Learning outcomes
After studying this tutorial you should be able to:
Describe the steps involved in pre-processing/cleaning sequencing data.
Distinguish between a good and a bad sequencing run.
Compute, investigate and evaluate the quality of sequence data from a sequencing experiment.
3.4. The data
First, we are going to download the data we will analyse. Open a shell/terminal.
# create a directory you work in
$ mkdir analysis

# change into the directory
$ cd analysis

# download the data
$ wget -O data.tar.gz https://osf.io/2jc4a/download

# uncompress it
$ tar -xvzf data.tar.gz
Note
Should the download fail, download manually from Downloads. Download the file to the ~/analysis directory and decompress.
The data is from a paired-end sequencing run data (see Fig. 3.2) from an Illumina HiSeq [GLENN2011]. Thus, we have two files, one for each end of the read.
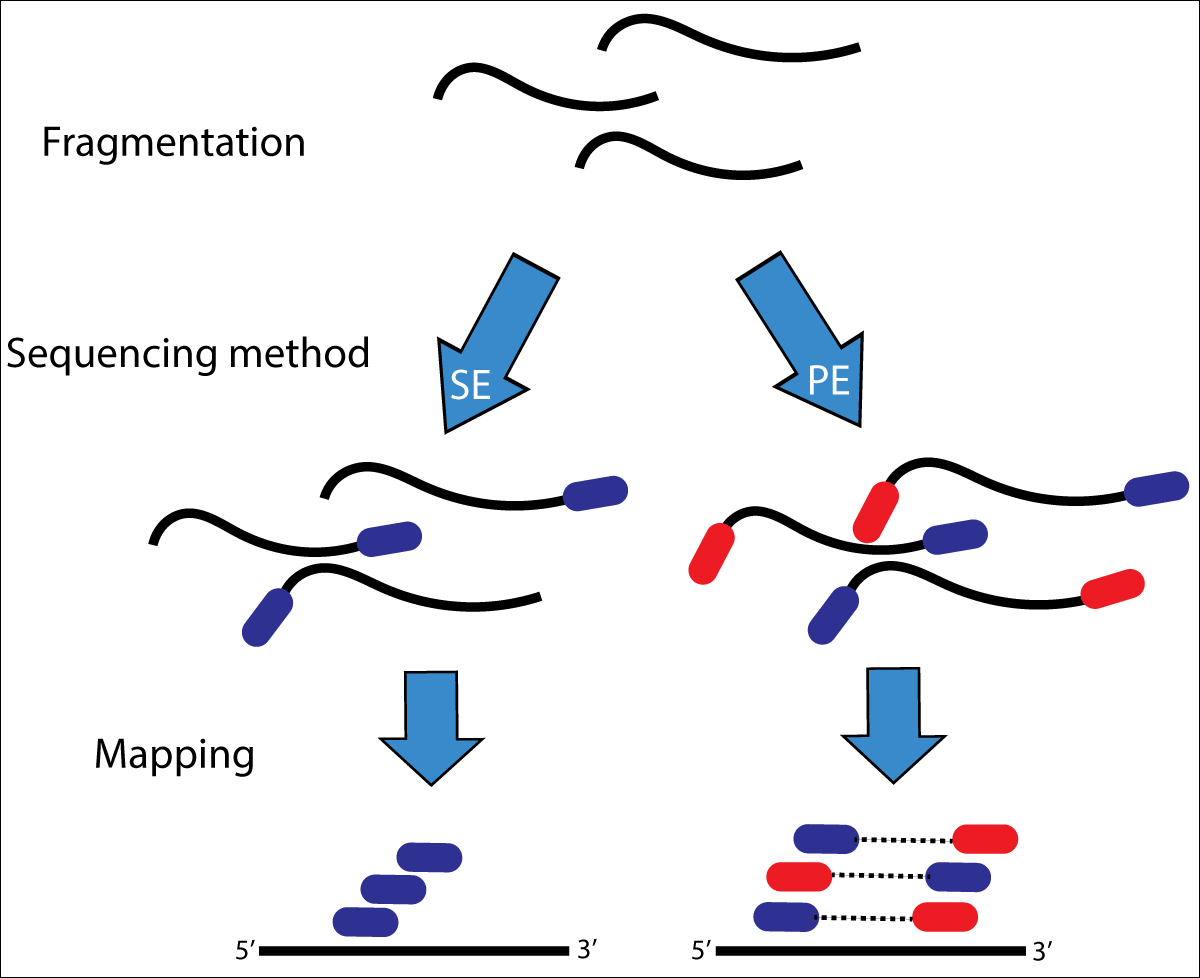
Fig. 3.2 Illustration of single-end (SE) versus paired-end (PE) sequencing.
If you need to refresh how Illumina paired-end sequencing works have a look at the Illumina technology webpage and this video.
Attention
The data we are using is “almost” raw data as it came from the machine. This data has been post-processed in two ways already. All sequences that were identified as belonging to the PhiX genome have been removed. This process requires some skills we will learn in later sections. Illumina adapters have been removed as well already! The process is explained below and we are going to run through the process anyways.
3.4.1. Investigate the data
Make use of your newly developed skills on the command-line to investigate the files in data folder.
Todo
Use the command-line to get some ideas about the file.
What kind of files are we dealing with?
How many sequence reads are in the file?
Assume a genome size of ~4.6 MB. Calculate the coverage based on this formula:
C = LN / G
C: CoverageG: is the haploid genome length in bpL: is the read length in bp (e.g. 2x150 paired-end = 300)N: is the number of reads sequenced
3.5. The fastq file format
The data we receive from the sequencing is in fastq format. To remind us what this format entails, we can revisit the fastq wikipedia-page!
A useful tool to decode base qualities can be found here.
Todo
Explain briefly what the quality value represents.
3.6. The QC process
There are a few steps one need to do when getting the raw sequencing data from the sequencing facility:
Remove PhiX sequences (we are not going to do this)
Adapter trimming
Quality trimming of reads
Quality assessment
3.7. PhiX genome
PhiX is a nontailed bacteriophage with a single-stranded DNA and a genome with 5386 nucleotides. PhiX is used as a quality and calibration control for sequencing runs. PhiX is often added at a low known concentration, spiked in the same lane along with the sample or used as a separate lane. As the concentration of the genome is known, one can calibrate the instruments. Thus, PhiX genomic sequences need to be removed before processing your data further as this constitutes a deliberate contamination [MUKHERJEE2015]. The steps involve mapping all reads to the “known” PhiX genome, and removing all of those sequence reads from the data.
However, your sequencing provider might not have used PhiX, thus you need to read the protocol carefully, or just do this step in any case.
Attention
We are not going to do this step here, as the sequencing run we are using did not use PhiX. Please see the Read mapping section on how to map reads against a reference genome.
3.8. Adapter trimming
The process of sequencing DNA via Illumina technology requires the addition of some adapters to the sequences. These get sequenced as well and need to be removed as they are artificial and do not belong to the species we try to sequence. Generally speaking we have to deal with a trade-off between accuracy of adapter removal and speed of the process. Adapter trimming does take some time.
Also, we have generally two different approaches when trimming adapter:
We can use a tool that takes an adapter or list of adapters and removes these from each sequence read.
We can use a tool that predicts adapters and removes them from each sequence read.
For the first approach we need to know the adapter sequences that were used during the sequencing of our samples. Normally, you should ask your sequencing provider, who should be providing this information to you. Illumina itself provides a document that describes the adapters used for their different technologies. Also the FastQC tool, we will be using later on, provides a collection of contaminants and adapters.
However, often (sadly) this information is not readily available, e.g. when dealing with public data. Thus, the second approach can be employed, that is, using a tool that predicts adapters.
Here, we are going to use the second approach with a tool called fastp to trim adapters and do quality trimming. fastp has a few characteristics which make it a great tool, most importantly: it is pretty fast, provides good information after the run, and can do quality trimming as well, thus saving us to use another tool to do this.
Quality trimming of our sequencing reads will remove bad quality called bases from our reads, which is especially important when dealing with variant identification.
# create env and install tools
$ conda create --yes -n qc fastp fastqc multiqc

# activate env
$ conda activate qc
Here, as an example we are trimming the sequence reads of the ancestor:
$ mkdir trimmed

$ fastp --detect_adapter_for_pe
        --overrepresentation_analysis
        --correction --cut_right --thread 2
        --html trimmed/anc.fastp.html --json trimmed/anc.fastp.json
        -i data/anc_R1.fastq.gz -I data/anc_R2.fastq.gz
        -o trimmed/anc_R1.fastq.gz -O trimmed/anc_R2.fastq.gz
--detect_adapter_for_pe: Specifies that we are dealing with paired-end data.--overrepresentation_analysis: Analyse the sequence collection for sequences that appear too often.--correction: Will try to correct bases based on an overlap analysis of read1 and read2.--cut_right: Will use quality trimming and scan the read from start to end in a window. If the quality in the window is below what is required, the window plus all sequence towards the end is discarded and the read is kept if its still long enough.--thread: Specify how many concurrent threads the process can use.--htmland--json: We specify the location of some stat files.-i data/anc_R1.fastq.gz -I data/anc_R2.fastq.gz: Specifies the two input read files-o trimmed/anc_R1.fastq.gz -O trimmed/anc_R2.fastq.gz: Specifies the two desired output read files
Todo
Run fastp also on the evolved samples.
Hint
Should you not get the commands together to trim the evolved samples, have a look at the coding solutions at Code: fastp. Should you be unable to run fastp at all to trim the data. You can download the trimmed dataset here. Unarchive and uncompress the files with tar -xvzf trimmed.tar.gz.
3.9. Quality assessment of sequencing reads
3.9.1. Installing FastQC
$ fastqc --help
            FastQC - A high throughput sequence QC analysis tool

SYNOPSIS

        fastqc seqfile1 seqfile2 .. seqfileN

    fastqc [-o output dir] [--(no)extract] [-f fastq|bam|sam]
           [-c contaminant file] seqfile1 .. seqfileN

DESCRIPTION

    FastQC reads a set of sequence files and produces from each one a quality
    control report consisting of a number of different modules, each one of
    which will help to identify a different potential type of problem in your
    data.

    If no files to process are specified on the command line then the program
    will start as an interactive graphical application.  If files are provided
    on the command line then the program will run with no user interaction
    required.  In this mode it is suitable for inclusion into a standardised
    analysis pipeline.
3.9.2. FastQC manual
FastQC is a very simple program to run that provides inforation about sequence read quality.
From the webpage:
“FastQC aims to provide a simple way to do some quality control checks on raw sequence data coming from high throughput sequencing pipelines. It provides a modular set of analyses which you can use to give a quick impression of whether your data has any problems of which you should be aware before doing any further analysis.”
The basic command looks like:
$ fastqc -o RESULT-DIR INPUT-FILE.fq(.gz) ...
-o RESULT-DIRis the directory where the result files will be writtenINPUT-FILE.fqis the sequence file to analyze, can be more than one file.
Hint
The result will be a HTML page per input file that can be opened in a web-browser.
3.9.3. MultiQC
MultiQC is an excellent tool to put FastQC (and other tool) results of different samples into context. It compiles all FastQC results and fastp stats into one nice web-page.
The use of MultiQC is simple. Just provide the command with a directories where multiple results are stored and it will compile a nice report, e.g.:
$ multiqc DIRECTORY DIRECTORY ...
3.10. Run FastQC and MultiQC on the trimmed data
Todo
Create a directory for the results –>
trimmed-fastqcRun FastQC on all trimmed files.
Visit the FastQC website and read about sequencing QC reports for good and bad Illumina sequencing runs.
Run MultiQC on the
trimmed-fastqcandtrimmeddirectoriesCompare your results to these examples (Fig. 3.3 to Fig. 3.5) of a particularly bad run (taken from the FastQC website) and write down your observations with regards to your data.
What elements in these example figures (Fig. 3.3 to Fig. 3.5) indicate that the example is from a bad run?
Hint
Should you not get it right, try the commands in Code: FastQC.
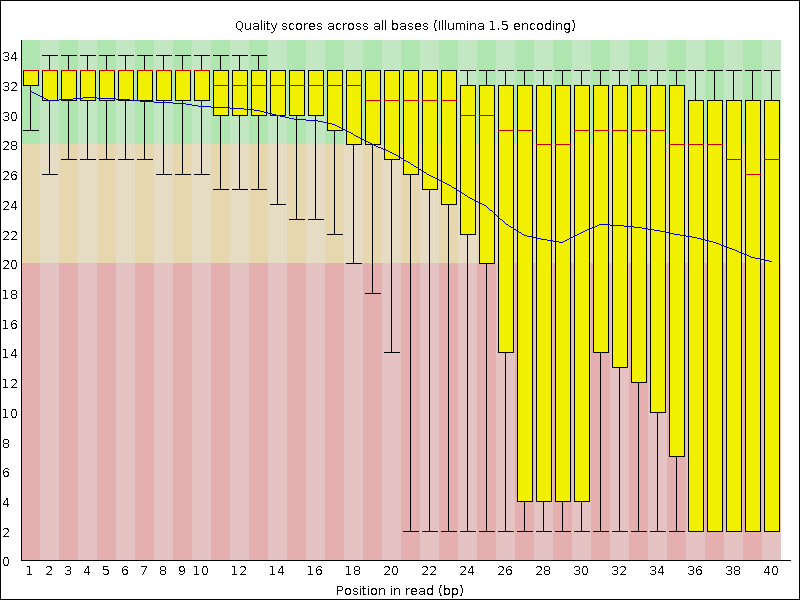
Fig. 3.3 Quality score across bases.
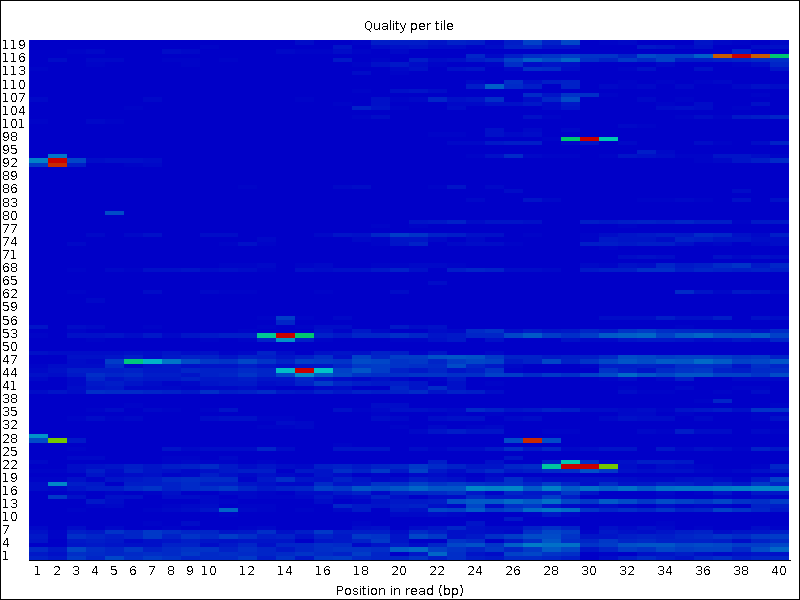
Fig. 3.4 Quality per tile.
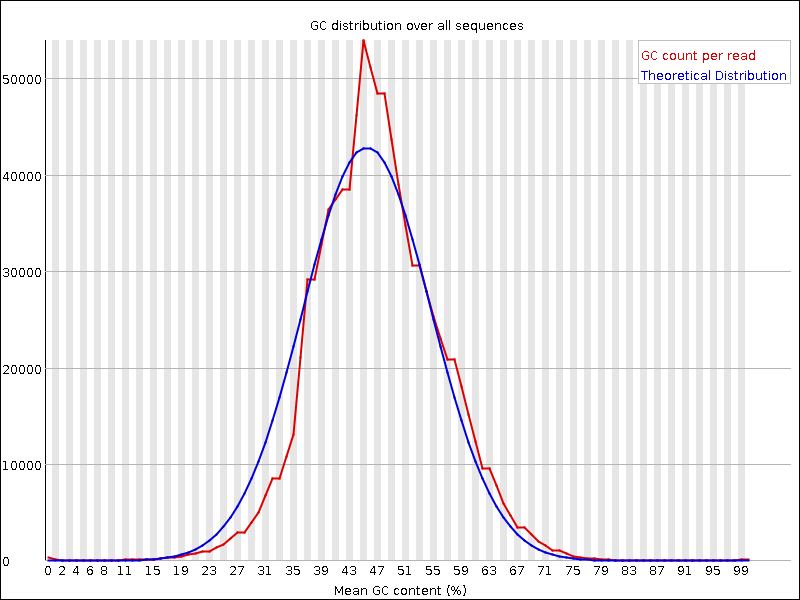
Fig. 3.5 GC distribution over all sequences.
References
- GLENN2011
Glenn T. Field guide to next-generation DNA sequencers. Molecular Ecology Resources (2011) 11, 759–769 doi: 10.1111/j.1755-0998.2011.03024.x
- KIRCHNER2014
Kirchner et al. Addressing challenges in the production and analysis of Illumina sequencing data. BMC Genomics (2011) 12:382
- MUKHERJEE2015
Mukherjee S, Huntemann M, Ivanova N, Kyrpides NC and Pati A. Large-scale contamination of microbial isolate genomes by Illumina PhiX control. Standards in Genomic Sciences, 2015, 10:18. DOI: 10.1186/1944-3277-10-18
- ROBASKY2014
Robasky et al. The role of replicates for error mitigation in next-generation sequencing. Nature Reviews Genetics (2014) 15, 56-62